How to Use the Terraform Datadog Provider
This guide provides an overview of how to define, version, and manage Datadog with Terraform, including setup and best practices.

Why Use Terraform for Datadog?
The value of managing Datadog as code goes beyond simple automation. It allows for:
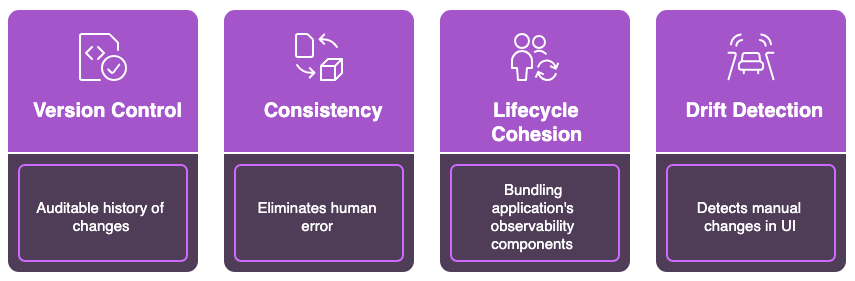
- Version Control & Auditability: By storing configurations in Git, you get a complete, auditable history of every change. This is invaluable for compliance, security reviews, and incident post-mortems.
- Consistency & Reliability: Automation eliminates the risk of human error from manual configuration. You can ensure that monitoring is applied consistently across all your environments, from development to production.
- Lifecycle Cohesion: You can bundle an application's observability components with its infrastructure. When you deploy a new service, the same
terraform applycan create the required servers, databases, and the corresponding Datadog monitors and dashboards. - Drift Detection:
terraform planacts as a powerful safety net. It detects any manual changes made in the Datadog UI, allowing you to either revert them or bring them into code, preventing configuration drift.
Getting Started: Provider Setup
Before you can manage any resources, you need to configure the Datadog provider.
First, declare the provider in your Terraform configuration. Pinning the version is a recommended best practice.
# main.tf
terraform {
  required_providers {
    datadog = {
      source  = "DataDog/datadog"
      version = "~> 3.66"
    }
  }
}
Next, you need to authenticate. The provider requires an API key and an Application key from your Datadog account. The most secure method is to set these as environment variables, which the provider automatically uses:
DD_API_KEYDD_APP_KEY
Finally, configure the provider block. If you are not using the default Datadog US1 site, you must specify your site's api_url.
# main.tf
provider "datadog" {
  # The provider will automatically use the environment variables
  # for api_key and app_key.

  # Example for a user on the EU site
  api_url = "https://api.datadoghq.eu/"
}
Practical Examples
With the setup complete, you can start defining Datadog resources.
Creating a Monitor
Monitors are the foundation of your alerting strategy. Here is how you can define a standard metric alert for high CPU usage, complete with warning and critical thresholds, a contextual message, and tags for routing.
resource "datadog_monitor" "high_cpu_usage" {
  name    = "High CPU Usage on {{host.name}}"
  type    = "metric alert"
  query   = "avg(last_5m):avg:system.cpu.user{*} by {host} > 80"
  message = "CPU usage is critically high on host {{host.name}}. Please investigate. @pagerduty-platform-team"

  monitor_thresholds {
    warning  = 70
    critical = 80
  }

  notify_no_data    = true
  no_data_timeframe = 20

  tags = ["service:core-api", "env:prod", "managed_by:terraform"]
}
Defining a Dashboard
You can define entire dashboards in code. A common challenge, however, is dynamically generating widgets. The standard datadog_dashboard resource is not well-suited for this.
The solution is to use the datadog_dashboard_json resource, which accepts a JSON string. This allows you to use Terraform's for expressions to programmatically generate your widget definitions.
# variables.tf
variable "widget_configurations" {
  type = map(object({
    title = string
    query = string
  }))
  default = {
    "cpu_usage" = {
      title = "CPU Usage",
      query = "avg:system.cpu.user{*}"
    },
    "memory_usage" = {
      title = "Memory Usage",
      query = "avg:system.mem.used{*}"
    }
  }
}

# main.tf
resource "datadog_dashboard_json" "programmatic_dashboard" {
  dashboard = jsonencode({
    title       = "Programmatically Generated Dashboard"
    layout_type = "ordered"
    widgets = [
      for key, config in var.widget_configurations : {
        definition = {
          type  = "timeseries"
          title = config.title
          requests = [
            {
              q = config.query
            }
          ]
        }
      }
    ]
  })
}
Defining a Service Level Objective (SLO)
Codifying SLOs is a cornerstone of modern SRE. This example defines a 99.9% availability SLO based on the ratio of successful API requests to total requests.
resource "datadog_service_level_objective" "api_availability" {
  name        = "API Request Availability"
  type        = "metric"
  description = "99.9% of all API requests should be successful (non-5xx)."

  query {
    numerator   = "sum:trace.http.request.hits{env:prod,service:core-api,!status_code:5xx}.as_count()"
    denominator = "sum:trace.http.request.hits{env:prod,service:core-api}.as_count()"
  }

  thresholds {
    target    = 99.9
    timeframe = "30d"
    warning   = 99.95
  }

  tags = ["service:core-api", "env:prod", "slo:availability"]
}
Best Practices
As your usage grows, managing a single, monolithic Terraform configuration becomes a bottleneck. To manage Datadog at scale, consider these best practices:
- Use Modules: Encapsulate common patterns into reusable modules. For example, create a "standard service" module that bundles monitors for latency, error rate, and saturation. This promotes consistency and reduces code duplication.
- Separate Environments: Use a directory-based structure to maintain separate state files for each environment (e.g.,
dev,staging,prod). This provides strong isolation and prevents changes in one environment from impacting another. - Split Your State: The biggest challenge at scale is a slow, monolithic Terraform state file. Split your state into smaller, more manageable units. Common strategies include splitting by team, by service, or by Datadog resource type. This dramatically improves performance and reduces the blast radius of any single change.
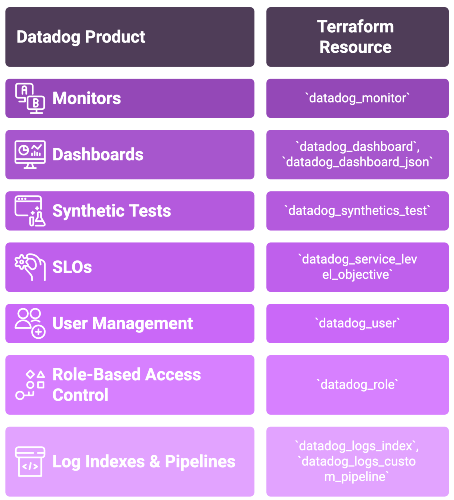
Datadog Product to Terraform Resource Mapping
The following table serves as a quick reference for mapping common Datadog products to their corresponding Terraform resource types.
Datadog Product | Primary Terraform Resource |
|---|---|
Monitors |
|
Dashboards |
|
Synthetic Tests |
|
Service Level Objectives (SLOs) |
|
User Management |
|
Role-Based Access Control |
|
Log Indexes & Pipelines |
|
Key Sources Used
Terraform Datadog Provider Documentation: registry.terraform.io/providers/DataDog/datadog/latest/docs
Datadog API Documentation: docs.datadoghq.com/api/latest/
Terraform Documentation: developer.hashicorp.com/terraform/docs
Terraform Registry (Datadog Modules): registry.terraform.io/search/modules?q=datadog
Terraformer by Google: github.com/GoogleCloudPlatform/terraformer
Datadog Provider GitHub Repository: github.com/DataDog/terraform-provider-datadog
You might also be interested in how to use the Terraform Okta Provider.