Introducing Scalr Metrics
Track, analyze, and optimize your IaC performance. Scalr Metrics provides critical data on run times and bottlenecks.

If you manage an Infrastructure-as-Code (IaC) pipeline, measuring its efficiency is essential. Slow Terraform runs and bottlenecks directly impact developer productivity and operational costs. Previously, gaining a clear, actionable view of this performance data was a manual task.
Scalr Metrics is a new feature providing comprehensive visibility into your infrastructure automation performance. It automatically surfaces critical data, enabling teams to identify and proactively address performance bottlenecks across all workspaces.
Scalr Metrics: Core Features and Purpose
Scalr Metrics converts raw run execution data into clear, actionable performance indicators. By analyzing historical data, it provides the insights necessary to maintain an efficient IaC platform.
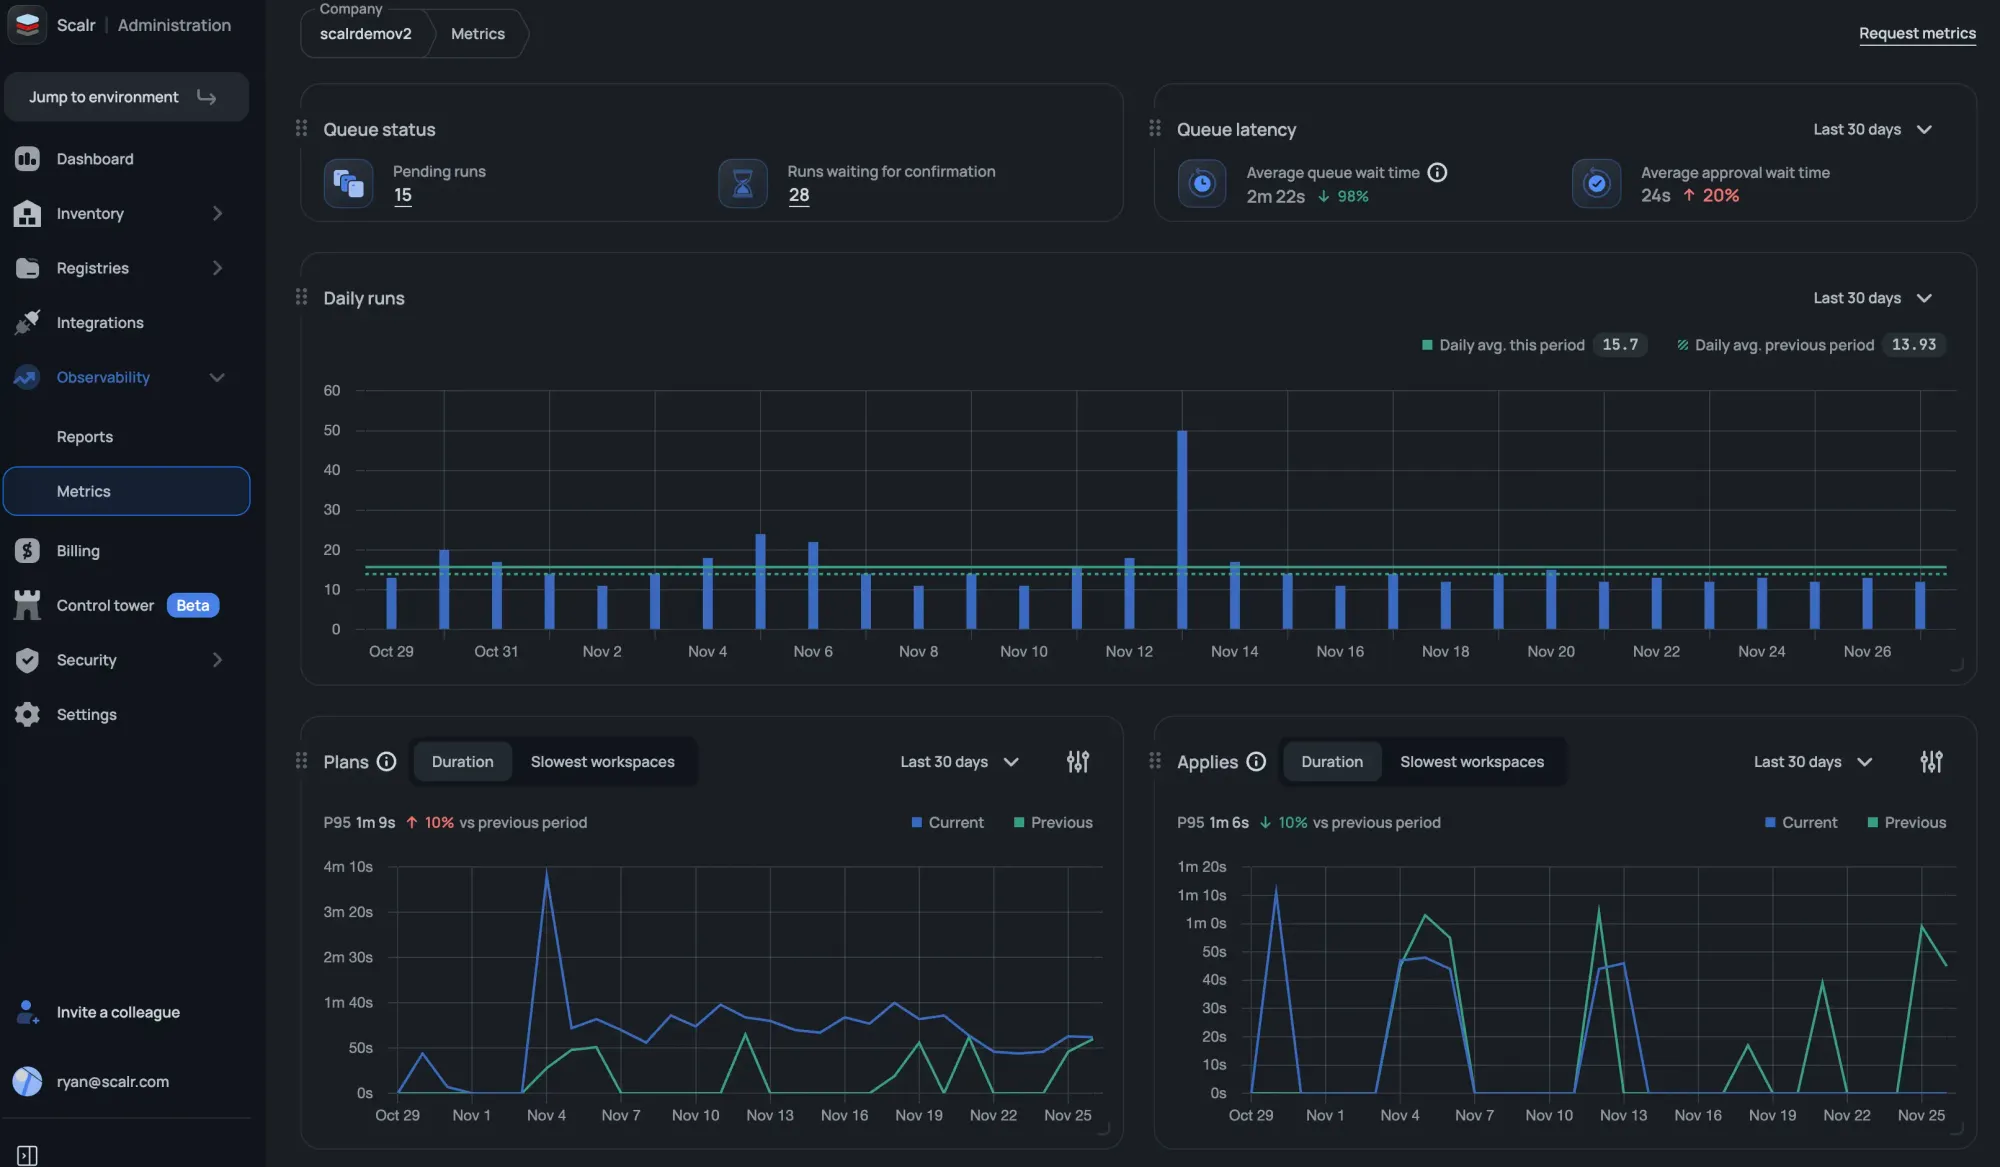
You can find the Metrics feature in the Admin scope under the Observability section. It tracks key indicators related to the duration of your runs.
Key Metrics Available:
The following metrics are available in the initial release:
- Apply duration trends (7, 30, and 90-day views)
- Plan duration trends (7, 30, and 90-day views)
- Slowest workspaces impacting apply performance
- Slowest workspaces impacting plan performance
- Daily run statistics
- Pending runs
- Runs waiting for confirmation
- Average queue wait time
- Average approval wait time
This is just the starting point; in the future, you will see data around the average time runs are waiting for approval, total runs in queue, drift detection metrics, and more! Filtering by environment and tags will also make it easier to remove lab or development workspaces that potentially skew the metrics.
Benefits of Using Scalr Metrics
Scalr Metrics assists engineering and platform teams in achieving several critical performance goals:
- Identify Bottlenecks: Easily pinpoint workspaces with consistently long execution times to investigate potential causes, such as resource count or provider configuration issues.
- Validate Changes: Use historical duration trends to objectively measure and confirm the performance impact of module updates or configuration changes.
- Proactive Optimization: Continuous monitoring of run duration trends enables teams to address performance degradation proactively, minimizing wait times for developers.
How to Access Scalr Metrics
To begin optimizing your automation using performance data, navigate to the Observability section within your Admin Scope.
For more detailed information on setup and usage, please refer to the official documentation:Scalr Metrics Documentation